Caution
This document is an English translation of the “freee Accessibility Guidelines.” The normative version of this document is in Japanese, and the English version is informational. The English translation is incomplete, and any links with their link texts left in Japanese are untranslated. Please be aware that there may be inaccuracies in the translation or parts that are outdated.
Checking Accessibility With axe DevTools
axe DevTools is a very commonly used accessibility checking tool. Its core functionality is implemented as axe-core which allows it to be used in various ways. Here, we will introduce how to use it as a browser extension to check the accessibility status of existing Web pages.
For specific instructions on how to conduct checks using axe DevTools, please refer to Examples of How to Conduct Checks Using axe DevTools. Also refer to Correspondence Between axe DevTools Rules and These Guidelines for additional information.
How to Install and Launch axe DevTools
You can install the Chrome extension from the Chrome Web Store.
axe DevTools - Web Accessibility Testing - Chrome ウェブストア
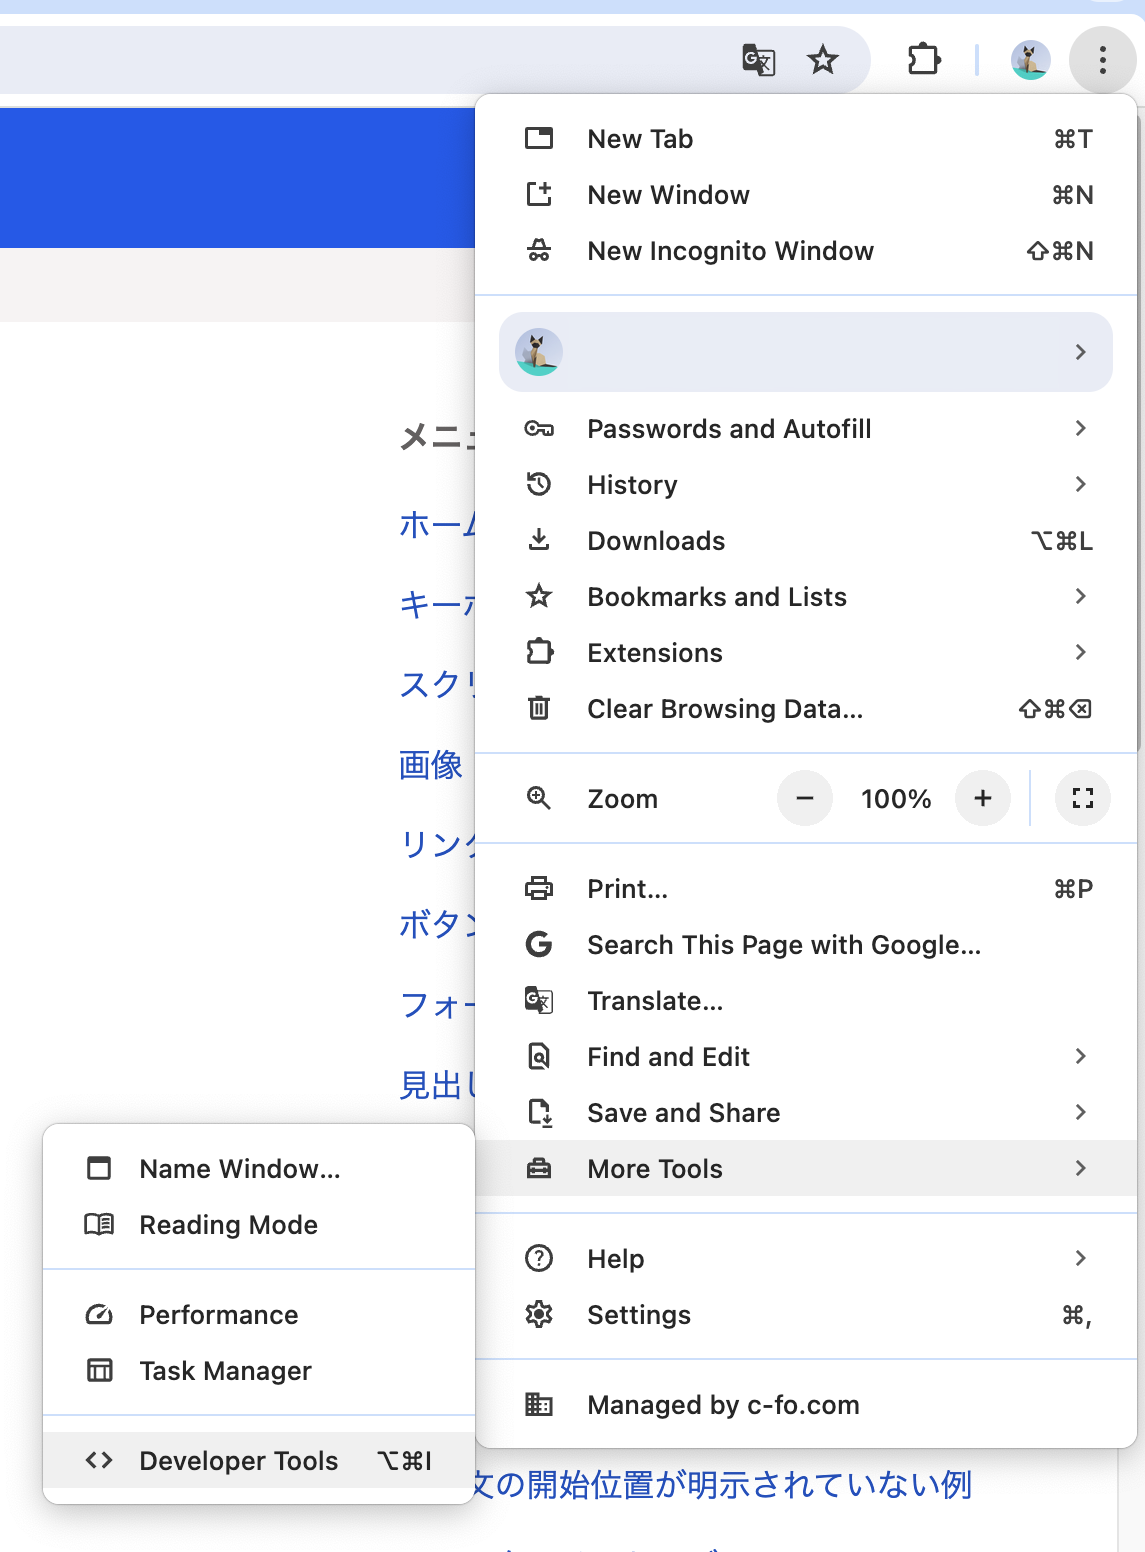
The axe DevTools extension is used within the developer tools.
With the page you want to analyze open, select from the button at the right end of the toolbar, or use the shortcut keys (Ctrl+Shift+I on Windows, Command+Option+I on macOS).
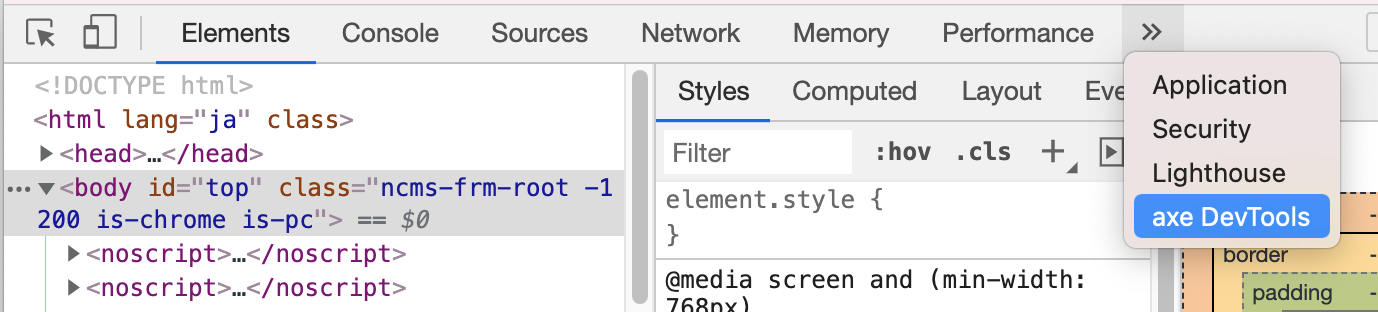
In the developer tools, select the “axe DevTools” tab.

If the display area of the developer tools is narrow, the “axe DevTools” may be hidden under the “>>” icon.
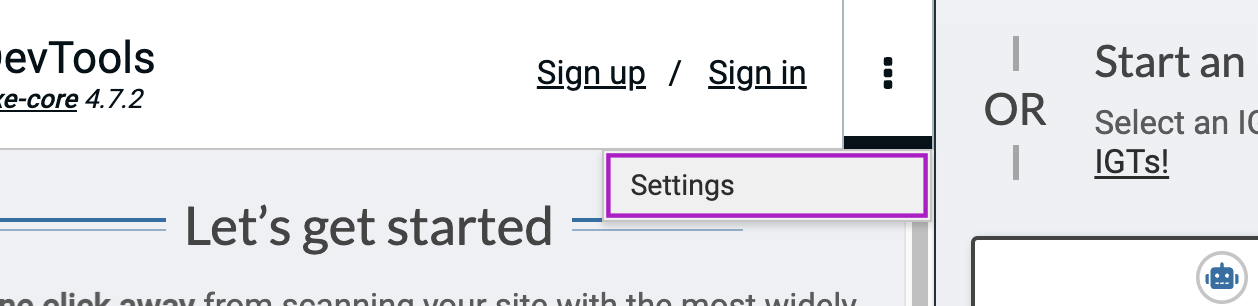
Initial Setup (Recommended)
To check more items, it is advisable to perform the following initial setup:
Click
Check “Enable” under “Best Practices”
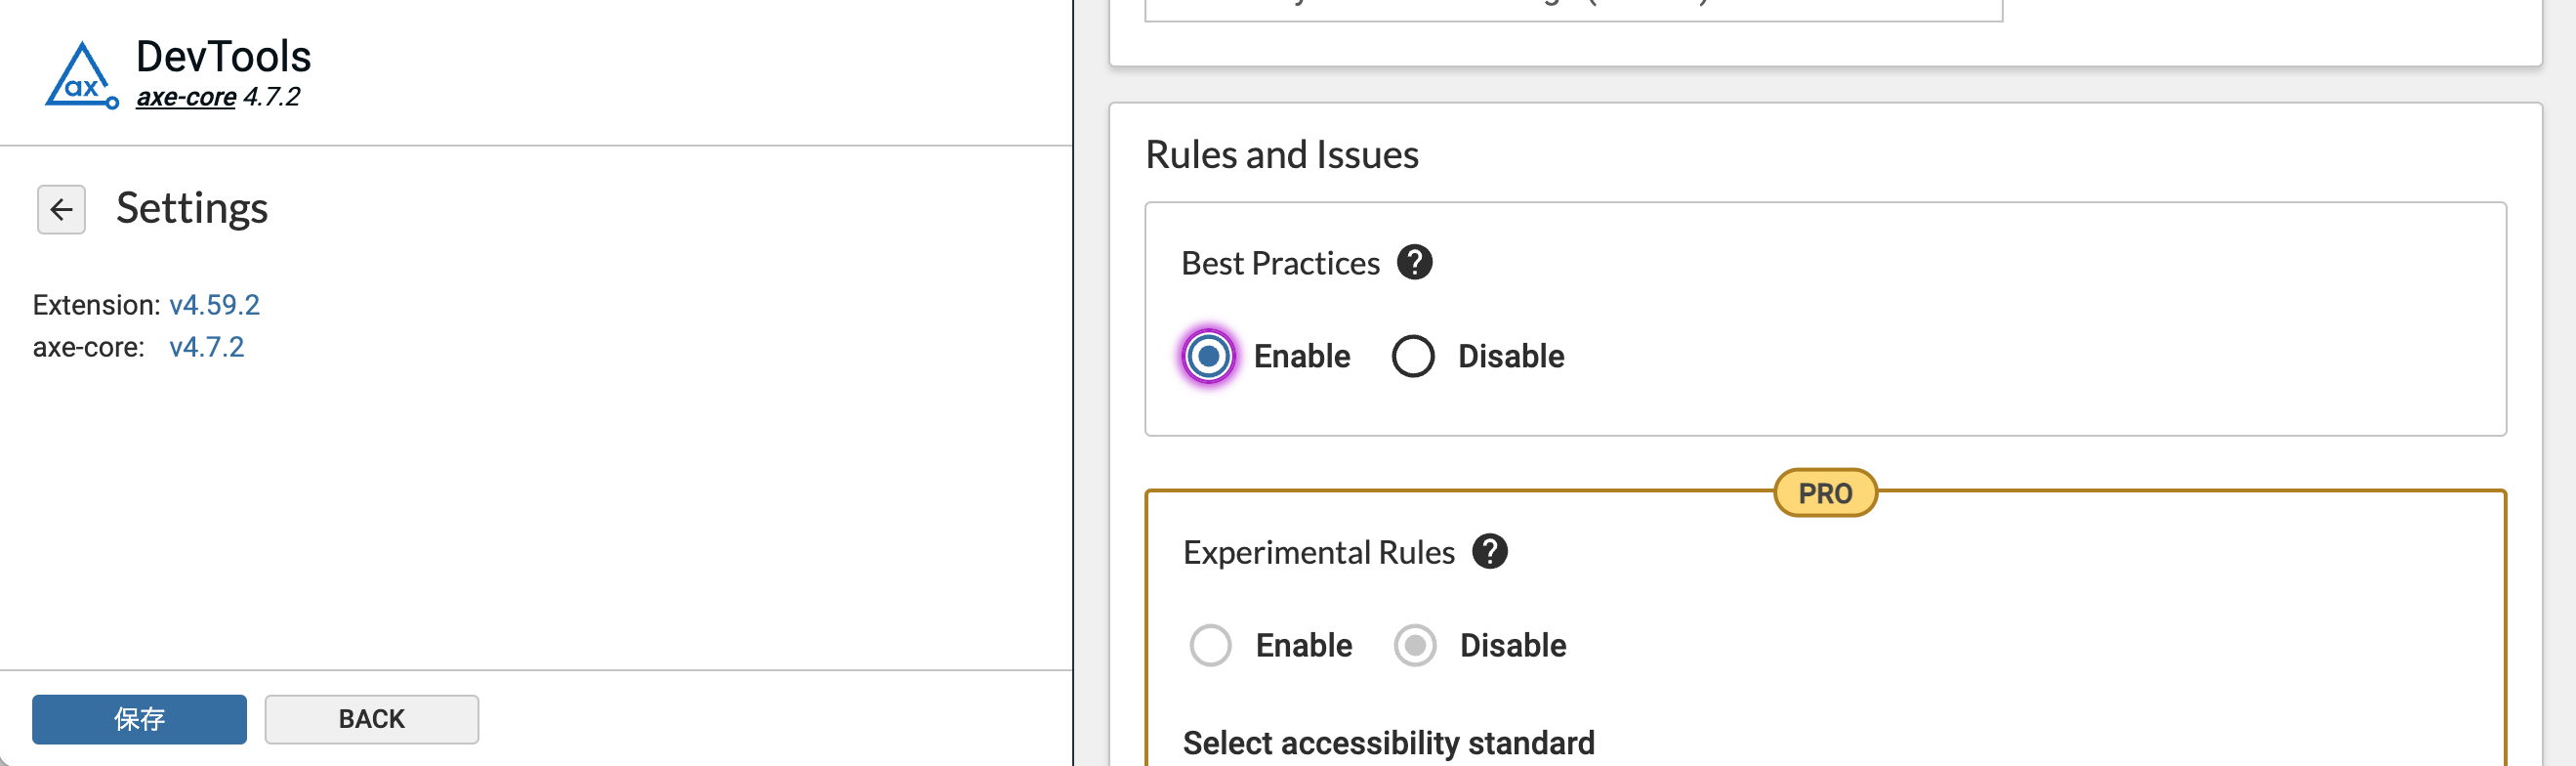
「Click “Save”
Analyzing the Current Page with axe DevTools
With the page you want to analyze open, open the axe DevTools tab within the developer tools and click the “SCAN ALL OF MY PAGE” button.
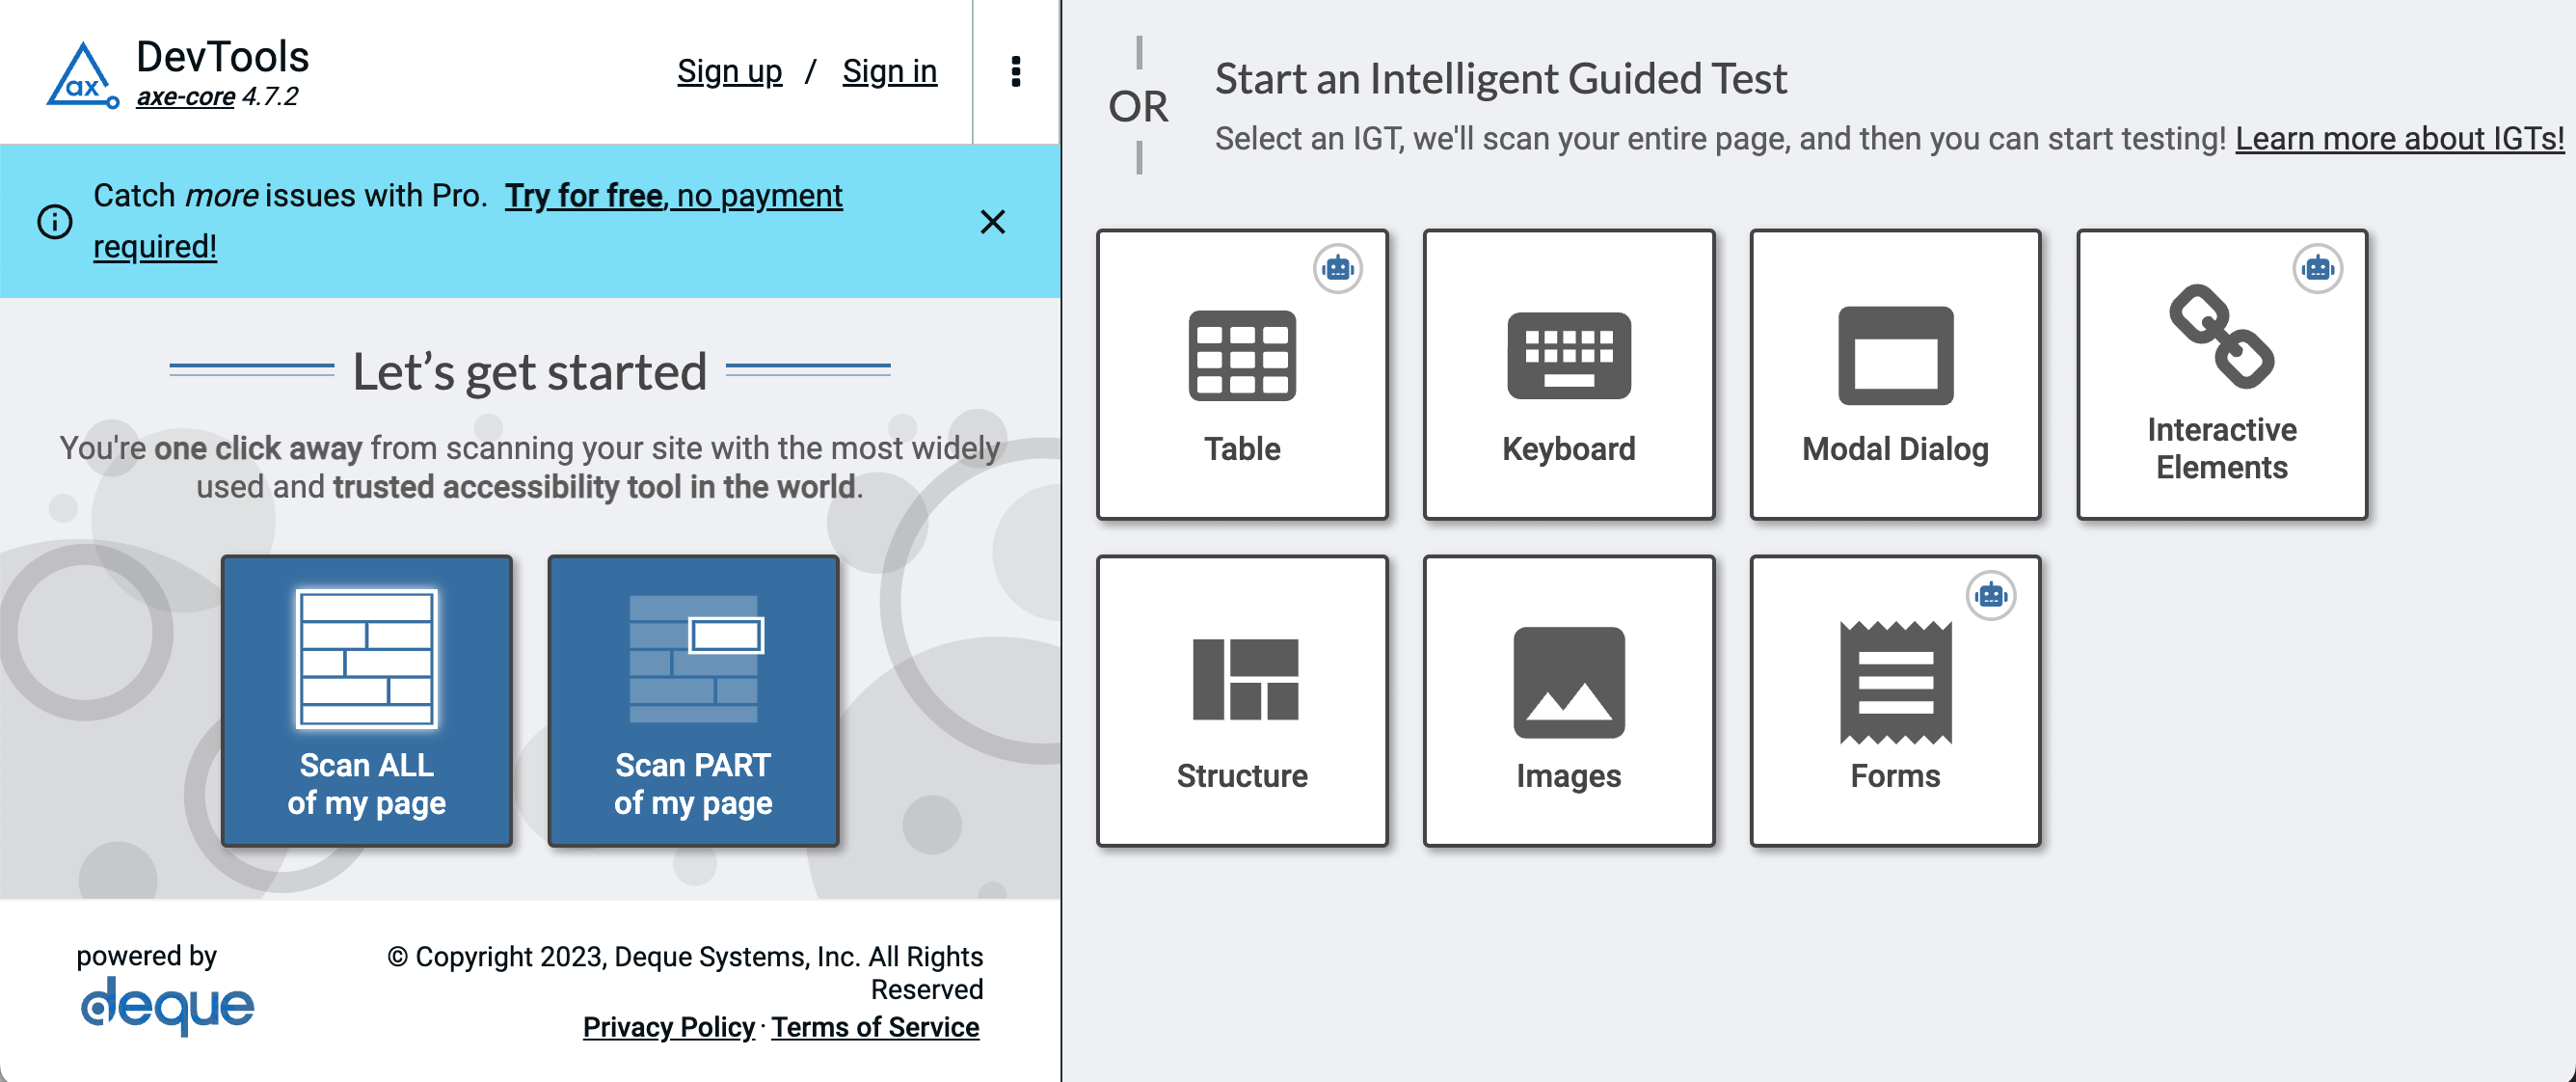
You can instantly identify issues on the current page.
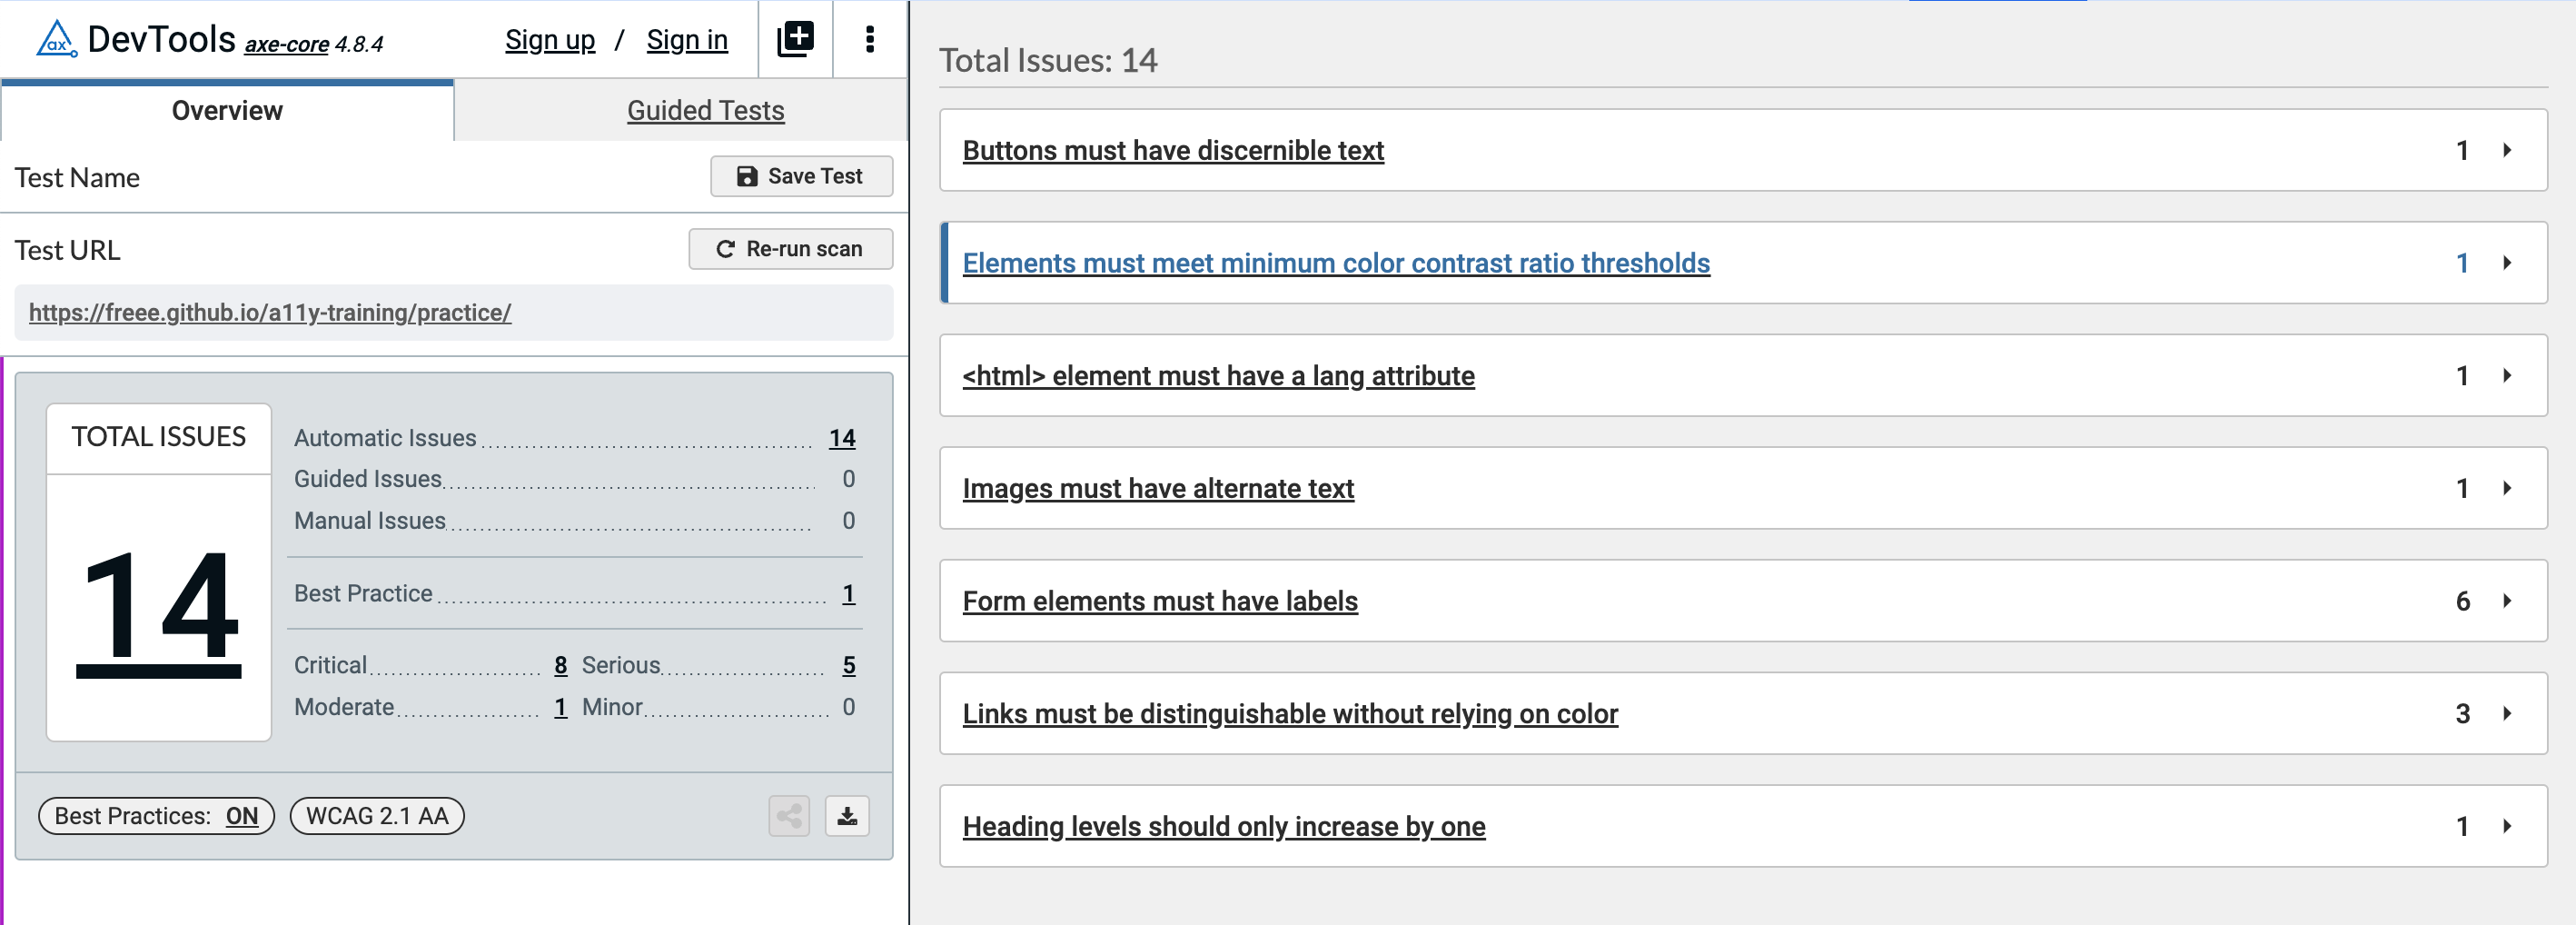
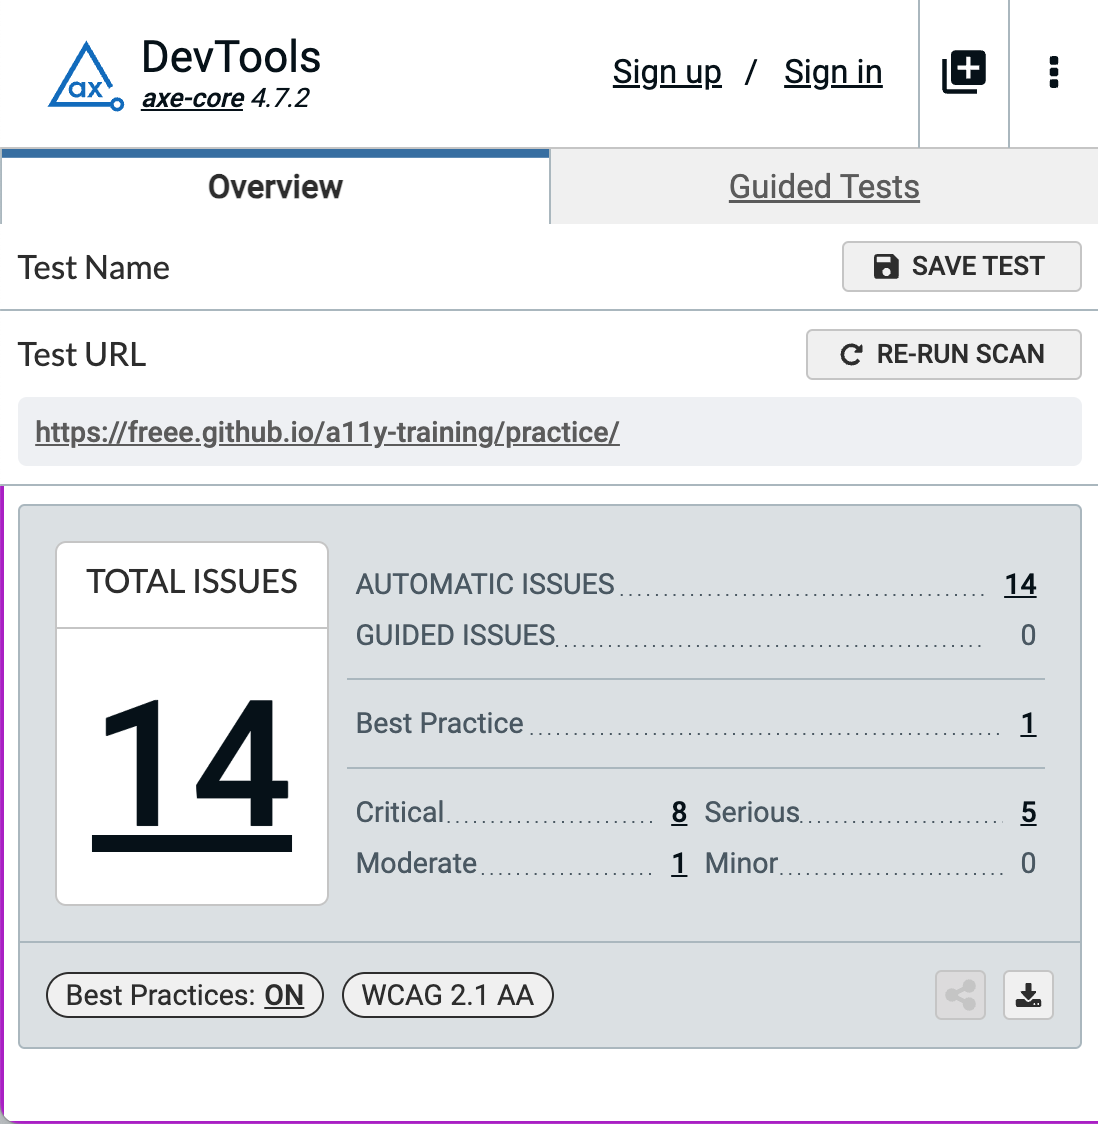
How to Read the Report
In the axe DevTools interface, there are two main areas: one displays the number of issues found, and the other shows the list of those issues.
The area that displays the number of issues found will show the count of problems on that page. Here, you can filter the list using User Impact (which is different from definitions like ‘severity’ within this guide) and “Best Practices” within axe DevTools.
You can view detailed information about each issue by clicking on it in the list of found problems.
The detailed view shows the location in the HTML where the issue occurs and provides information for fixing it.
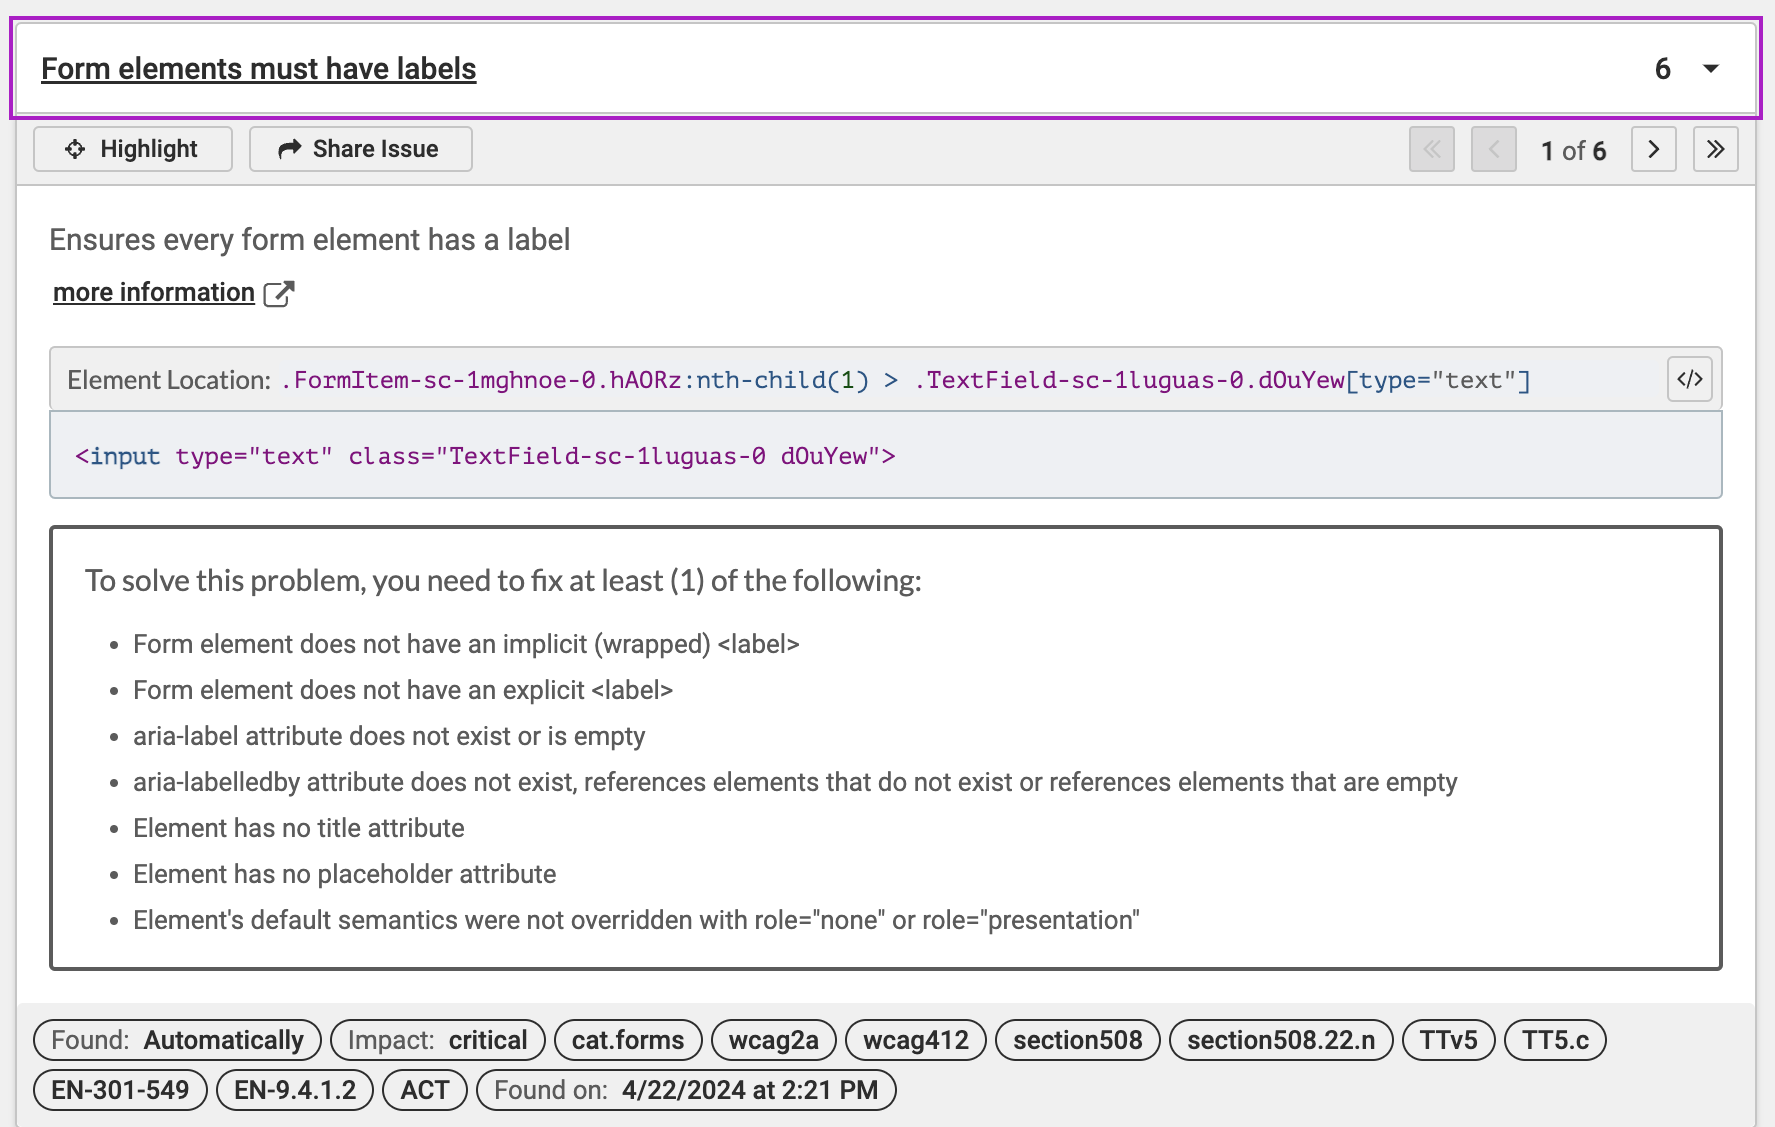
If the same issue is found in multiple places, the count is displayed on the list, and you can check each one using the pager in the detail view.
Considerations When Using axe DevTools
In areas where modal dialogs or accordions open and close, it is necessary to analyze with axe DevTools several times in both the opened and closed states.
While axe DevTools alone cannot detect all issues, it can instantly identify problems that can be programmatically detected. It is also extremely useful for pinpointing areas that may require further investigation.